BusinessLogger Overview
What is BusinessLogger?
BusinessLogger is a logger library created to track and monitor exceptions or business-level errors in the Navida Pro application.
Agenda
When you want to monitor how the backend behaves:
- During specific condition matches
- When any execution breaks
- Or when you want to track or observe certain business data
You can leverage the BusinessLogger library and monitor the data in real-time using a Grafana board.
How It Works
Let’s look at a traditional logging example:
try {
    service.getCMSDataForGoalById(123);
} catch (Exception e) {
    logger.error("Error occurred during get CMS goal data for goal id {} due to {}", goalId, e.getMessage());
}
This log will appear in the application logs. To view it:
- You’ll need to connect to OpenSearch
- Locate the service-specific log
In cases of pod restarts or large log volumes, retrieving this log can be difficult.
Using BusinessLogger
you can use businessLogger like this:
businessLogger.info/warn/debug/error(true,"your log message")
NOTE Here the first parameter specifies whether do we need to persist this log Audit db or not. if we don't specify this value as true then it works as normal log and monitoring the log will be won't work.
try {
    service.getCMSDataForGoalById(123);
} catch (Exception e) {
    businessLogger.error(true, "Error occurred during get CMS goal data for goal id {} due to {}", goalId, e.getMessage());
}
This way:
- The log appears in your app logs and
- It is persisted in the audit service DB
- It can then be visualized in Grafana
How to Add BusinessLogger in Your Class
Step 1: Declare the Logger
private final BusinessLogger businessLogger;
Step 2: Inject Logger via Constructor
public CachedChallengeCMSService(OtherDependencies,
                                 LoggerFactoryUtility loggerFactoryUtility) {
    // Assign other dependencies
    this.businessLogger = loggerFactoryUtility.getLogger(CachedChallengeCMSService.class);
}
Step 3: Use the Logger
Use the logger wherever you need to audit your log:
businessLogger.info/warn/debug/error(true, "your log message");
What Does BusinessLogger Capture?
When you log with businessLogger, the following information is captured and stored:
| Field | Description |
|---|---|
| Service name | In which microservice the log was triggered |
| Function name | The method name where log was written |
| Trace ID | Unique trace ID for the request |
| Exception time | Timestamp when the log was executed |
| Exception msg | Message you passed to businessLogger |
| Error type | INFO, WARN, DEBUG, ERROR, (CRITICAL coming) |
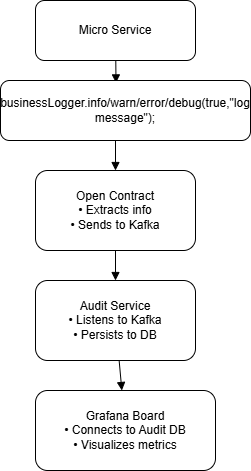
BusinessLogger Flow
1. Service Layer
You write the log using:
businessLogger.info/warn/error/debug(true,"Your log message");
2. Open Contract
In the shared Open Contract library:
- The
businessLoggermethod is implemented - It extracts service name, trace ID, etc.
- The data is sent to Kafka
3. Audit Service
A dedicated microservice called Audit Service:
- Consumes logs from Kafka
- Persists the log data into the Audit schema DB
4. Grafana Dashboard
The Grafana board:
- Connects to the Audit DB
- Displays key business-level logs & metrics visually
Flow Diagram
Below is the flow diagram illustrating how BusinessLogger works across different components in the system:
Summary
Using BusinessLogger allows:
- Better observability
- Centralized error tracking
- Visual monitoring via Grafana
It’s a structured and efficient way to track critical and non-critical business errors across your microservices.